What formula is used to calculate the shortage of goods? Example of problem solving
The equilibrium price is the price at which the quantity demanded in the market is equal to the quantity supplied. Expressed as Qd(P) = Qs(P) (see basic market parameters).
Purpose of the service. This online calculator is aimed at solving and checking the following problems:
- Equilibrium parameters of a given market (determining the equilibrium price and equilibrium volume);
- Coefficients of direct elasticity of demand and supply at the equilibrium point;
- Consumer and seller surplus, net social gain;
- The government introduced a commodity subsidy for each unit of goods sold in the amount of N rubles;
- The amount of subsidies allocated from the state budget;
- The government introduced a commodity tax on each unit of goods sold in the amount of N rubles;
- Describe the consequences of the government’s decision to fix the price N above (below) the equilibrium price.
Instructions. Enter the supply and demand equations. The resulting solution is saved in a Word file (see example of finding the equilibrium price). A graphical solution to the problem is also presented. Qd - demand function, Qs - supply function
Example. The demand function for this product is Qd=200–5P, the supply function is Qs=50+P.
- Determine the equilibrium price and equilibrium sales volume.
- Let's assume that the city administration decided to set a fixed price at: a) 20 den. units per piece, b) 30 den. units a piece.
- Analyze the results obtained. How will this affect the behavior of consumers and producers? Present the solution graphically and analytically.
Solution.
Let's find the parameters of equilibrium in the market.
Demand function: Qd = 200 -5P.
Supply function: Qs = 50 + P.
1. Equilibrium parameters of this market.
At equilibrium Qd = Qs
200 -5P = 50 + P
6P = 150
P equals = 25 rub. - equilibrium price.
Q equals = 75 units. - equilibrium volume.
W = P Q = 1875 rub. - seller's income.
Consumer surplus measures how much better off individuals are on average, on average.
Consumer surplus(or gain) is the difference between the maximum price that he is willing to pay for the product and the one that he actually pays. If we add up the surpluses of all consumers who purchase a given product, we get the size of the total surplus.
Producer surplus(profit) - this is the difference between the market price and the minimum price for which producers are willing to sell their goods.
Seller's surplus (P s P 0 E): (P equal - Ps)Q equal / 2 = (25 - (-50))75 / 2 = 2812.5 rub.
Buyer's surplus (P d P 0 E): (Pd - P equal)Q equal / 2 = (40 - 25)75 /2 = 562.5 rub.
Net social gain: 2812.5 + 562.5 = 3375
Knowledge of surpluses is widely used in practice, for example, when distributing the tax burden or subsidizing industries and firms.
2) Suppose that the city administration decided to set a fixed price at 20 den. units a piece
P fixed = 20 rub.
Quantity demanded: Qd = 200 -5 20 = 100.
Quantity supplied: Qs = 50 + 1 20 = 70.
After fixing the price, the quantity demanded decreased by 25 units. (75 - 100), and the deficit of manufacturers decreased by 5 units. (70 - 75). There is a shortage of goods on the market of 30 items. (70 - 100). 
Let's assume that the city administration decided to set a fixed price at 30 den. units a piece.
P fixed = 30 rub.
Quantity demanded: Qd = 200 -5 30 = 50.
Quantity supplied: Qs = 50 + 1 30 = 80.
After fixing the price, the volume of demand increased by 25 units. (75 - 50), and producer surplus increased by 5 units. (80 - 75). There is a surplus of goods in the market of 30 pcs. (80 - 50). 
Task 1. Construct a graph of market equilibrium for refrigerators in a store per day. Determine the equilibrium price (Pe) and the equilibrium sales volume (Qe). Determine the presence of shortages and surpluses of goods at prices of 100 and 400 rubles.
1. Demand function: Q D = 900 – R.
2. Supply function: Q S = 100 + 3P.
Solution:
1. Using functions, we determine the equilibrium price and equilibrium sales volume. To do this, let's equate the functions.
900 – P = 100 + 3P, 900 – 100 = 3P + P, 800 = 4P, Pe = 200 – equilibrium price.
Let us substitute the resulting equilibrium price into any of the functions: Q D = 900 – 200 = 700 or Q S = 100 + 3x200 = 700. Equilibrium sales volume Qе = 700.
2. Let's build a scale.
Table 2.4
Supply and Demand Scale
Using a scale, we determine the surplus and shortage of goods at prices of 100 and 400.
A price of 100 below the equilibrium price (P = 200) means a shortage of goods. Let us subtract from the volume of demand at this price 800 the volume of supply of 400. The shortage is 400 (400 refrigerators are not enough for buyers). Manufacturers will raise prices to avoid shortages.
A price of 400 above the equilibrium price means an excess of goods. Let us subtract from the volume of supply 1300 the volume of demand 500. The surplus of goods is 800 (manufacturers are ready to sell 800 more refrigerators than buyers want and can buy). Manufacturers will reduce the price to the equilibrium price in order to sell all their products.
3. Let’s construct a graph of market equilibrium for refrigerators per day using points from the scale. For the demand curve, take the points: P 1 = 100, Q 1 = 800; P 2 = 400, Q 2 = 500.
For the supply curve: P 1 = 100, Q 1 = 400; P 2 = 400, Q 2 = 1300.
Figure 2.4. Market Equilibrium Graph
Answer. Equilibrium price Pe = 200, equilibrium sales volume Qe = 700. At a price of 100, the deficit is 400 refrigerators, at a price of 400 the surplus is 800 refrigerators.
Task 2. Draw a market equilibrium graph, determine the equilibrium price and sales volume. Determine and calculate the shortage and surplus of goods at prices: 5, 15, 20.
Demand function: Q D = 50 – 2P.
Supply function: Q S = 5 + P.
Solution:
Table 2.5
Supply and Demand Scale
|
R, price |
Q D |
Q S |

Rice. 2.5. Market Equilibrium Graph
Answer. The equilibrium price is 15, the equilibrium sales volume is 20. At a price of 5 rubles: the deficit is 30. At a price of 15 rubles: market equilibrium. At a price of 20 rubles: excess goods 15.
2.2. Elasticity of supply and demand
Having studied the concepts of supply and demand, market equilibrium and equilibrium price, we will become familiar with elasticity. It is not enough for an entrepreneur to be able to determine the equilibrium price to achieve market equilibrium. The market situation is unstable, business activity is influenced by environmental factors: suppliers, buyers, competitors, tax and monetary policies of the state, etc. Many factors lead to price changes - lowering or increasing.
Therefore, an entrepreneur needs to know how supply and demand will change when prices for his products change. Even before opening a company, the entrepreneur determines what elasticity he will work with the product in order to know what price manipulations he can carry out to increase sales volumes, and which ones will lead to a drop in supply and demand.
As you know, the market, in the economic sense of the word, works according to certain rules and laws that regulate the price, shortage of goods or their surplus. These concepts are key and affect all other processes. What is a commodity deficit and surplus, as well as the mechanisms of their occurrence and elimination are discussed below.
Basic Concepts
The ideal situation in the market is the same amount of goods offered for sale and buyers ready to purchase it at a set price. This correspondence between supply and demand is called the price that is established under such conditions, also called equilibrium. However, such a situation can only occur at a single point in time, but cannot persist for a long period. Constant changes in supply and demand due to many variable factors cause either an increase in demand or supply. This is how phenomena called commodity shortages and commodity surpluses arise. The first concept defines the excess of demand over supply, and the second - exactly the opposite.

Emergence and elimination of market-wide deficiencies
The main reason why a commodity shortage occurs at a certain point in time is a sharp increase in demand, to which supply does not have time to respond. However, if the state or insurmountable specific factors (wars, natural disasters, etc.) do not interfere in the process, the market is able to independently regulate this process. It looks like this:
- Demand increases and commodity shortages arise.
- The equilibrium price rises, which pushes the producer to increase production volumes.
- The quantity of goods on the market is increasing.
- Commodity appears
- The equilibrium price falls, which initiates a reduction in production volumes.
- The state of supply and demand is stabilizing.
Such processes occur continuously in the market and are part of the country’s economic system. However, if there is a deviation from the scheme outlined above, then regulation does not occur; the consequences can be very complex: constant and one group and an excess of another, growing discontent among the population, the emergence of shadow production, supply and sales schemes, etc.

An example from the recent past
Commodity shortages can also arise due to excessive interference in market processes, which often occurs in planned or command economies. A striking example of this is the shortage of food and food products in the 80s in the USSR. An overly extensive, busy and completely inflexible production planning and purchasing system, along with the growing welfare of the population and the availability of free funds, led to the fact that store shelves were empty, and huge queues lined up for any product that was available. Manufacturers did not have time to satisfy the needs of the consumer, since they did not have the ability to quickly respond to demand - all processes were strictly subordinated to bureaucratic procedures that took too long and could not meet market requirements. Thus, for a fairly long period of time, a constant commodity deficit was established throughout the country’s market. It is difficult for a command economy to cope with this phenomenon due to the factors listed above, so the problem can be solved either by completely restructuring the system or by changing it.
Phenomenon in microeconomics
Commodity shortages can arise not only throughout the economy of the entire country, but also at individual enterprises. It can also be either temporary or permanent, and is characterized by a lack of finished products to cover the demand for it. But unlike macroeconomic processes in an enterprise, the balance of inventories and demand, on the contrary, depends on the quality of planning. True, the speed of production’s response to market changes is also important. At the microeconomic level, a commodity shortage has a number of consequences: loss of profit, the likelihood of losing both regular and potential customers, and deterioration of reputation.

Causes and consequences of surplus
An excess of supply of any product or an entire group over demand causes a surplus. This phenomenon is also called surplus. The emergence of surplus in a market economy is a natural process - a consequence of imbalance - and is independently regulated in the following way:
- Decreased demand or excess supply.
- The emergence of a surplus.
- Decrease in market price.
- Decrease in production and supply.
- Increase in market price.
- Stabilization of supply and demand.
In a planned economy, commodity surpluses are a consequence of incorrect forecasting. Since such a system is unable to self-regulate due to excessive intervention, the surplus can last for quite a long time without the possibility of its regulation.

Enterprise-wide surplus
There is also a surplus within a single enterprise. Commodity shortages and surpluses in microeconomics are regulated not by the market, but “manually”, i.e. primarily through planning and forecasting. If errors are made in these processes, then products not sold on time create surpluses, which can lead to monetary losses. This is especially acute for grocery enterprises and others whose sales period for goods is short. Also, a surplus can cause significant harm to the financial stability of industries whose products are seasonally dependent.
It is impossible to solve the problem of supply and demand balance once and for all, either on a national scale or within an individual enterprise. In addition, such a decision is not required, since deficits and surpluses are important processes that, among other things, stimulate the development of the economy and production, as well as interstate trade and relations in the context of exports and imports.
The manual is presented on the website in an abbreviated version. This version does not include testing, only selected tasks and high-quality assignments are given, and theoretical materials are cut by 30%-50%. I use the full version of the manual in classes with my students. The content contained in this manual is copyrighted. Attempts to copy and use it without indicating links to the author will be prosecuted in accordance with the legislation of the Russian Federation and the policies of search engines (see provisions on the copyright policies of Yandex and Google).
9.2 Disequilibrium market states
Market equilibrium means that at the current price, buyers and sellers have no incentive to change this situation. But this situation is not always achieved - there are many situations when, for certain reasons, buyers or sellers have incentives to change the market situation. Let's take a closer look at them.
9.2.1. Shortage
Shortage– a market situation in which the volume of demand is greater than the volume of supply at a given price level.
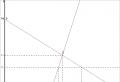
Market shortage
The above graph shows that at a price P 1 the quantity demanded exceeds the quantity supplied. At the specified price, the supply of sellers is not enough to cover the desire of buyers to buy the product. Line segment ( Q d - Q s) is the size of the deficit. Market equilibrium in this case is at point 0, that is, goods are bought and sold on the market in the amount Q s by price P 1.
If there is a shortage in the market, sellers, feeling that at a given price the quantity demanded exceeds the quantity supplied, will have incentives to sell more goods at a higher price. If there are no restrictions in the market, then this situation will not last long, since efficient sellers will take advantage of the presence of a shortage to achieve their interests in making a profit. Existing sellers will want to sell more goods at a higher price, and then the quantity supplied will increase. The result will be an increase in sales volume in a scarce market while prices rise. This is how the “invisible hand” of the market works: while pursuing their own interests, sellers at the same time satisfy the interests of buyers.
But shortages can persist for a long time if price growth on the market is limited. As we will see a little later, this can happen due to government regulation of markets, for example, when the government limits prices from rising. Why is deficit bad? The obvious answer is that customers cannot satisfy their needs. But also, some firms that could sell goods on the market at a higher price have no incentive to do so. The result of chronic deficits is a distortion of incentives in the economy. When prices are limited from rising, and long queues form for goods, the seller is not interested in competition by improving the quality of the product and the level of service. In this case, the seller stops caring about the quality of the product and begins to work “formally”. Stores in scarcity economies start late and close early, service is slow, and there are long lines in stores. You don’t need to look far for an example; just remember the economy of the Soviet Union.
David Hoffman in his book “Oligarchs” described the following typical picture of the late Soviet Union: “the population from the suburbs of Moscow traveled to the city by electric train in order to buy at least some products, usually bread and canned goods. Often at the station one could see elderly people carrying bags filled with cheap canned seaweed and stale bread. These people had rolls of toilet paper hanging around their necks, because it also couldn’t be bought anywhere except in the center of Moscow.” Now this seems wild, but this is how many of our parents lived, and it was under these conditions that future oligarchs made their first capital.
One of the consequences of chronic shortages is the emergence of a shadow market. If a product cannot be purchased at higher official prices, then enterprising traders, if there is unsatisfied demand, will have incentives to sell the product on the shadow market at higher unofficial prices. In the scarce economy of the Soviet Union, many shadow market institutions existed and flourished, such as sales under the counter, sales through connections and agreements.
Let's consider a simple shadow market model. Let there be a market with an existing restriction on the maximum price level (price ceiling), and, as a consequence, with a stable deficit:

With the existing price ceiling P 1 the volume of purchases and sales in the market is equal to Q S, that is, the minimum of the volumes of supply and demand, and the size of the deficit is equal to ( Q d - Q S). In this case, sellers may discover that there is pent-up demand in the market and will have incentives to fill it at a price above the cap. In this case, sellers will sell the product at a price not lower than the set of prices of their supply curve. In this case, the shadow market can be represented by a shaded triangle on the chart. Any point located in this triangle satisfies the desires of buyers to buy and the desires of sellers to sell goods.
9.2.2. Excess
Excess (overstocking)- a market situation in which the volume of supply is greater than the volume of demand at a given price level.

The presence of a surplus is explained by the fact that the existing price on the market, for one reason or another, turns out to be higher than the possible equilibrium price. For example, this may be due to the presence of restrictions on the minimum acceptable price level (price floor). As we will see later, this may be one of the measures of government regulation of markets. In this case, the volume of supply turns out to be greater than the volume of demand, and overstocking (excess) occurs in the market. Its size is ( Q s - Q d). In this case, volume is bought and sold on the market Q s by price P 1. That is, as in the case of a shortage, the sales volume is equal to the lesser of the supply and demand volumes.
In a situation of surplus of goods, as in the case of a shortage, a shadow market may arise. In this case, some sellers will have incentives to sell goods at prices lower than officially established ones, that is, “in the shadows”

Both in the case of a surplus and in the case of a shortage, the volume of sales on the market is always equal to the minimum value of the amount of demand and the amount of supply (the volume of demand in the case of a surplus and the volume of supply in the case of a shortage).
A price of 100 below the equilibrium price (P = 200) means a shortage of goods. Let us subtract from the volume of demand at this price 800 the volume of supply of 400. The shortage is that there are not enough refrigerators for buyers). Manufacturers will raise prices to avoid shortages.
A price of 400 above the equilibrium price means an excess of goods. Let us subtract from the volume of supply 1300 the volume of demand 500. The surplus of goods is 800 (manufacturers are ready to sell 800 more refrigerators than buyers want and can buy). Manufacturers will reduce the price to the equilibrium price in order to sell all their products.
3. Let’s construct a graph of market equilibrium for refrigerators per day using points from the scale. For the demand curve, take the points: P1 = 100, Q 1 = 800; P2 = 400, Q 2 = 500.
For the supply curve: P1 = 100, Q 1 = 400; P2 = 400, Q 2 = 1300.
Figure 2.4. Market Equilibrium Graph
Answer. Equilibrium price Pe = 200, equilibrium sales volume Qe = 700. At a price of 100, the deficit is 400 refrigerators, at a price of 400 the surplus is 800 refrigerators.
Task 2.Draw a market equilibrium graph, determine the equilibrium price and sales volume. Determine and calculate the shortage and surplus of goods at prices: 5, 15, 20.
Demand function: QD = 50 – 2 P.
Suggestion function: QS = 5 + P .
Solution:
Table 2.5
Supply and Demand Scale
R, price | QD | QS |

Rice. 2.5. Market Equilibrium Graph
Answer. The equilibrium price is 15, the equilibrium sales volume is 20. At a price of 5 rubles: the deficit is 30. At a price of 15 rubles: market equilibrium. At a price of 20 rubles: excess goods 15.
2.2. Elasticity of supply and demand
Having studied the concepts of supply and demand, market equilibrium and equilibrium price, we will become familiar with elasticity. It is not enough for an entrepreneur to be able to determine the equilibrium price to achieve market equilibrium. The market situation is unstable, business activity is influenced by environmental factors: suppliers, buyers, competitors, tax and monetary policies of the state, etc. Many factors lead to price changes - lowering or increasing.
Therefore, an entrepreneur needs to know how supply and demand will change when prices for his products change. Even before opening a company, the entrepreneur determines what elasticity he will work with the product in order to know what price manipulations he can carry out to increase sales volumes, and which ones will lead to a drop in supply and demand.
2.2.1. Elasticity of demand
Basic Concepts
Elasticity of demand – shows how much the volume of demand for a product will change in response to changes in factors such as price, consumer income, and the price of another product.
Price elasticity of demand – shows how much the quantity demanded changes when the price of a product changes.
A good may have elastic demand, inelastic demand, or unit elastic demand. To determine the type of elasticity, we use two indicators:
1. Elasticity coefficient.
2. The total revenue of the seller.
1. Price elasticity of demand (ED)– shows the relative change in the volume of demand with a relative change in price.
To calculate we use the formula:
ED= | Q2 – Q1 | P1+P2 | ||
P2–P1 | Q1+Q2 |
where P1 is the initial price of the product,
P2 – new price,
Q 1 – initial volume of demand
Q2 – new volume of demand.
The coefficient of price elasticity of demand shows by what percentage the quantity demanded will change when the price changes by 1%.
There are three types of elasticity of demand:
· easily replaceable goods (meat, fruits).
Products with price inelastic demand:
· basic necessities (medicines, shoes, electricity);
· goods whose cost is insignificant for the family budget (pencils, toothbrushes);
· hard-to-replace goods (bread, light bulbs, gasoline).
Factors of price elasticity of demand.
1. Availability of substitute and complementary goods on the market. The more close substitutes a product has, the higher its elasticity of demand and vice versa. If a good is a less significant complement to an important good, then the demand for it is usually inelastic.
2. The time frame within which the purchase decision is made. Over short periods of time, demand is less elastic than over long periods.
2. Seller's total revenue TR we calculate using the formula:
TR = P x Q , (2.9)
where P is the price of the product,
Q is the quantity of goods at this price.
Examples of problem solving
Task 1. When the price of milk increases from 30 to 35 rubles. for 1 liter in the store, the volume of demand for it decreased from 100 to 98 liters. Determine the type of elasticity of demand for milk, the change in the total revenue of the seller.
Solution
1. Let's calculate .
P1 = 30 rubles, P2 = 35 rubles.
Q 1 = 100 l, Q 2 = 98 l.
ED= | Q2 – Q1 | P1+P2 | ||
P2–P1 | Q1+Q2 |
ED= | 98 – 100 | 30 + 35 | = – 0,13% |
|
35 – 30 | 100 + 98 |
|ED | = 0.13%< 1% – объём спроса сократился в меньшей степени (на 0,13%), чем выросла цена (на 1%), поэтому молоко – товар неэластичного спроса.
2. Let’s determine how the seller’s revenue will change if the price of milk increases from 30 to 35 rubles. per liter
Let's calculate the revenue at the initial price of 30 rubles.
TR 1 = P 1 x Q 1
TR 1 = 30 x 100 = 3000 rub.
Let's calculate the seller's revenue at the new price of 35 rubles.
TR 2 = P 2 x Q 2
TR 2 = 35 x 98 = 3430 rub.
∆TR = TR 2 – TR 1
∆TR = 3430 – 3000 = 430 rub.
Answer. Since milk |ED |< 1%, то спрос неэластичен, то есть он слабо реагирует на изменение цены. При повышении цены на молоко объём спроса сократился незначительно. Поэтому выручка продавца, несмотря на повышение цены, выросла на 430 руб.
Task 2. When the price of apples increases from 65 to 90 rubles. for 1 kg in the store, the volume of demand for it decreased from 30 to 18 kg. Determine the type of elasticity of demand for apples, the change in the seller’s total revenue.
Solution
1. Let's calculate coefficient of price elasticity of demand.
P1 = 65 rubles, P2 = 90 rubles.
Q 1 = 30 kg, Q 2 = 18 kg.
ED= | Q2 – Q1 | P1+P2 | ||
P2–P1 | Q1+Q2 |
ED= | 18 – 30 | 65 + 90 | = – 1,55% |
|
90 – 65 | 30 + 18 |
|ED | = 1.55% > 1% – the volume of demand decreased to a greater extent (by 1.55%) than the price increased (by 1%), therefore apples are a product of elastic demand.
2. Let’s determine how the seller’s revenue will change if the price of apples increases from 65 to 90 rubles. per kg.
Let's calculate the revenue at the initial price of 65 rubles.
TR 1 = P 1 x Q 1
TR 1 = 65 x 30 = 1950 rub.
Let's calculate the seller's revenue at the new price of 90 rubles.
TR 2 = P 2 x Q 2
TR 2 = 90 x 18 = 1620 rub.
Let's calculate the change in revenue and draw a conclusion.
∆TR = TR 2 – TR 1
∆TR = 1620 – 1950 = –330 rub.
Answer. Since on apples |ED | > 1%, then demand is elastic, that is, it is sensitive to price changes. When the price of milk increases, the quantity demanded decreases more than the price increases. Therefore, the seller’s revenue decreased by 330 rubles.
Task 3. When the price of umbrellas increases from 500 to 1000 rubles. for 1 umbrella in the store
the volume of demand for them decreased from 80 to 40 pcs. Determine the type of elasticity of demand, the change in the seller's total revenue.
Solution:
1. Let's calculate price elasticity of demand.
P1 = 500 rub., P2 = 1000 rub.
Q 1 = 80 pcs., Q 2 = 40 pcs.
ED= | Q2 – Q1 | P1+P2 | ||
P2–P1 | Q1+Q2 |
ED= | 40 – 80 | 500 + 1000 | ||
1000 – 500 | 80 + 40 |
|ED | = 1% = 1% – the volume of demand decreased to the same extent as the price increased (by 1%), therefore the umbrella is a product of demand with unit elasticity.
2. Determine how the seller’s revenue will change.
TR 1 = P 1 x Q 1
TR 1 = 500 x 80 = 40,000 rub.
Let's calculate the seller's revenue at the new price of 1000 rubles.
TR 2 = P 2 x Q 2
TR 2 = 1000 x 40 = 40,000 rub.
Let's calculate the change in revenue and draw a conclusion.
∆TR = TR 2 – TR 1
∆ TR = 0 rub.
Answer. Since on the umbrella |ED | = 1%, then the demand of unit elasticity, that is, the volume of demand, changes to the same extent as the price. Therefore, the seller's revenue did not change after the price change.
2.2.2. Elasticity of supply
Basic Concepts
Elasticity of supply – the ability of supply or its quantity to change as a result of changes in market prices.
Depending on the level of the supply elasticity coefficient, the following types of elasticity are distinguished.
1. If Ed>1, then the offer elastic, it is sensitive to changes in the price situation, even a slight change in price leads to a significant change in sales volumes; When the price falls, the volume of sales decreases significantly, and when the price increases, the volume of sales increases.
2. If Ed < 1, то предложение inelastic, it reacts poorly to changes in the price situation; even a significant change in price does not lead to significant changes in sales volumes. The manufacturer cannot benefit from a favorable market situation, and if the price decreases, it suffers losses.
3. If Ed= 1, then the sentence unit elasticity, changes in supply and price occur in the same proportion, the income and profit of the manufacturer remain the same.
Price elasticity coefficient of supply(ES) shows the relative change in quantity supplied with a relative change in price.
The calculation formula is similar to the formula for calculating ED.
ES = | Q2 – Q1 | P1+P2 | ||
P2–P1 | Q1+Q2 |
The elasticity of supply depends on many factors:
1. Long-term storage capabilities and storage costs. A product that cannot be stored for a long time or is expensive to store has a low elasticity of supply.
2. Specifics of the production process. In the case where the producer of a good can either increase its output when the price rises, or produce another good when the price decreases, the supply of this good will be elastic.
3. Time factor. The manufacturer cannot quickly respond to price changes, since it takes a certain amount of time to hire additional workers, purchase means of production (when it is necessary to increase output), or to lay off some workers, to pay off a bank loan (when it is necessary to reduce output). In the short term, supply can be increased by an increase in demand (price) only through more intensive use of existing production capacities. However, such intensity can only increase market supply by a relatively small amount. Consequently, in the short run, supply is low price elastic. In the long run, entrepreneurs can increase their production capacity by expanding existing capabilities and by firms building new enterprises. Thus, in the long run, the price elasticity of supply is quite significant.
4. Prices of other goods, including resources. In this case we are talking about cross elasticity of supply.
5. The degree of achieved use of resources: labor, material, natural. If these resources are not available, then the supply response to elasticity is very small.
Examples of problem solving
Task 1. When the price of yoghurts increases from 15 to 25 rubles. for 1 piece in the store, the volume of supply for them increased from 100 to 110 pcs. Determine the type of supply elasticity, the change in the seller's total revenue.
Solution:
1. Let's calculate coefficient of price elasticity of supply.
P1 = 15 rubles, P2 = 25 rubles.
Q 1 = 100 pcs., Q 2 = 110 pcs.
ES = | Q2 – Q1 | P1+P2 | ||
P2–P1 | Q1+Q2 |
ES = | 110 – 100 | 15 + 25 | ||
25 – 15 | 100 + 110 |
ES = 0.19%< 1% – объём предложения увеличился в меньшей степени (на 0,19%) чем выросла цена (на 1%), поэтому йогурт – товар неэластичного предложения.
2. Let’s determine how the seller’s revenue will change if the price of yogurt increases from 15 to 25 rubles. for 1 piece
Let's calculate the revenue at the initial price of 15 rubles.
TR 1 = P 1 x Q 1
TR 1 = 15 x 100 = 1500 rub.
Let's calculate the seller's revenue at the new price of 25 rubles.
TR 2 = P 2 x Q 2
TR 2 = 25 x 110 = 2750 rub.
Let's calculate the change in revenue and draw a conclusion.
∆TR = TR 2 – TR 1
∆TR = 2750 – 1500 = 1250 rub.
Answer. Since on yogurt ES< 1%, то предложение неэластично, то есть оно слабо реагирует на изменение цены. Выручка продавца выросла на 1250 руб.
Task 2. When the price of shirts is reduced from 500 to 450 rubles. for 1 piece in the shop
the volume of supply for them decreased from 70 to 50 pieces. Determine the type of supply elasticity, the change in the seller's total revenue.
Solution:
1. Let's calculate price elasticity of supply.
P1 = 500 rub., P2 = 450 rub.
Q 1 = 70 pcs., Q 2 = 50 pcs.
ES = | Q2 – Q1 | P1+P2 | ||
P2–P1 | Q1+Q2 |
ES = | 50 – 70 | 500 + 450 | ||
450 – 500 | 70 + 50 |
ES = 3.17% > 1% – the supply volume decreased to a greater extent (by 3.17%) than the price decreased (by 1%), therefore shirts are a product of elastic supply.
2. Let’s determine how the seller’s revenue will change if the price of shirts decreases from 500 to 450 rubles. for 1 piece
Let's calculate the revenue at the initial price of 500 rubles.
TR 1 = P 1 x Q 1
TR 1 = 500 x 70 = 35,000 rub.
Let's calculate the seller's revenue at the new price of 450 rubles.
TR 2 = P 2 x Q 2
TR 2 = 450 x 50 = 22,500 rub.
Let's calculate the change in revenue and draw a conclusion.
∆TR = TR 2 – TR 1
∆TR = 22,500 – 35,000 = – 12,500 rub.
Answer. Since the shirt has ED > 1%, supply is elastic, that is, it is sensitive to price changes. The seller's revenue decreased significantly - by 12,500 rubles. It is not profitable for a manufacturer to reduce prices for goods of elastic demand due to a reduction in revenue.
3. PRODUCTION COSTS
In a market economy, the goal of producers is to maximize profits. Therefore, entrepreneurs choose which product to produce, focusing on consumer demand and the possibility of making a profit. To increase profits, enterprises use new technologies and reduce costs.
Production volumes are affected by costs. If they increase, then the company reduces production volumes. If costs are reduced, supply increases.
Basic Concepts
Costs- these are the costs incurred by the company in organizing the production and marketing of products.
Classification of costs
1. Fixed costs (FC)- costs that do not directly depend on the volume of output and which the company incurs even if production stops completely.
2. Variable costs (VC)- costs that directly depend on the volume of output and include costs for the purchase of raw materials, energy, production services, etc.
3. General costs (TC)– the sum of fixed and variable costs:
TC = FC + VC(3.1)
4. Average fixed costs (AFC)– fixed costs per unit of production, which can be calculated using the formula:
5. Average variable costs (AVC)– variable costs:
6. Average total costs– total costs per unit of production:
AC =AFC+AVC(3.4)
Economies of scale
Economies of scale– changes in production costs and business indicators due to an increase in production volume .
Depending on the character they distinguish three economies of scale:
1. Positive
2. Negative
3. Permanent.
Positive effect– with an increase in production volumes, production costs decrease.
Negative effect– as production volumes increase, costs rise.